canvas
A canvas is a region of the screen in which 3D objects are displayed. A canvas named scene is created automatically. By default, 3D objects will be assigned at creation to the most recently created canvas in a program. An object can be assigned to a specific canvas by setting the canvas attribute of the object: mybox.canvas = scene2. Every 3D canvas actually has a 2D overlay in which label objects are displayed.
- canvas(width=600, height=300, background=color.white)
- Parameters:
width (scalar) – Width of canvas in pixels. Default 640.
height (vector) – Height of canvas in pixels. Default 400
background (vector) – Color of background. Default color.black
Attributes used less often:
- canvas(resizable=True, visible=True, align='left')
- Parameters:
visible (boolean) – If False, no objects are displayed in this canvas. Default is True.
resizable (boolean) – If False, user cannot resize the canvas. Default is True.
align (string) – Default is ‘none’. Options are ‘left’, ‘right’, ‘none’.
pixel_to_world (scalar) – Width of a pixel in world coordinates. Read-only.
Methods:
- mycanvas.select()
Makes mycanvas the active one (so objects created subsequently will go into it).
- current = canvas.get_selected()
Returns the selected canvas.
A canvas can also be specified explicitly when creating an object.
Alignment
Setting align to ‘left’ forces a canvas to the left side of a window. To place a graph to the right of a canvas, set align to ‘left’ for the canvas, and set align to either ‘right’ or ‘left’ for the graph. (If your window isn’t wide enough to display both, the graph will appear under the canvas.)
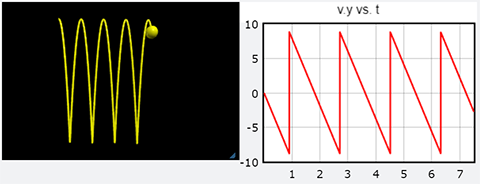
The canvas (aligned left) displays a bouncing ball. The graph (also aligned left) shows the y-component of the ball’s velocity as a function of time.
Resizing
If mycanvas is a resizeable canvas, then mycanvas.bind('resize', myfunction) will execute the function myfunction() when the user resizes the canvas. If the function has the form myfunction(myevent), then myevent.type will be ‘resize’ and myevent.canvas will be ‘mycanvas’.
Objects in a Canvas
For a canvas named scene:
scene.camera is the camera in the canvas.
scene.objects is a list of all the visible objects in the canvas.
scene.lights is a list of all the lights in the scene.
scene.delete() Deletes all objects in the canvas, then deletes the canvas itself.
Screen Capture
scene.capture(myfilename) Sends a screen shot of the canvas to your Downloads folder as a file named myfilename.png. Subsequent captures will be named myfilename(1).png and so on.
scene.capture(myfilename, False) Capture does not include label objects. Default is True.
Caption and Title
A canvas can have a title, which appears above the canvas, and a caption, which appears below the canvas. The text can include simple html elements.
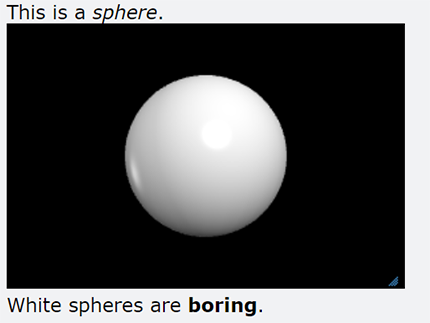
In this image, the title contains the text “This is a <i>sphere</i>” . The caption contains the text “White spheres are <b>boring</b>.”
- canvas(title='This is the <i>Title</i>', caption='This is the <b>caption</b>')
- Parameters:
title (string) – A string that appears above the canvas.
caption (string) – A string that appears below the canvas.
To append text to a caption use:
mycanvas.append_to_caption(“Some additional text.”)
You can use standard Python formatting for numerical elements.
Widgets such as buttons, menus, and sliders can also be placed in either the title or the caption area. For dynamically modifiable text in a caption, use wtext.
Redraw Events
VPython redraws the entire canvas about 60 times per second. If for some reason you want to wait for the screen to start or finish a redraw you can use scene.waitfor().
Starting a redraw
- evt = scene.waitfor('redraw')
Completing a redraw
- evt = scene.waitfor('draw_complete')
See also