curve
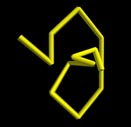
The curve object consists of a list of points connected by straight lines. If points are close enough together curves can appear smooth. Points are supplied as a list of vectors; points can also be appended one at a time to the curve.
- curve(pos=[vec(- 1, 3, 2), vec(2, 0, - 1)], color=color.yellow)
- Parameters:
pos (list of vectors) – List of positions of points in curve. Default is [] (no points).
color (vector) – Default color.white
radius (scalar) – The radius of the curve. Default is 0, which gives a very thin curve.
size (vector) – Changing size scales the entire curve. Default <1,1,1>.
origin (vector) – Changing the origin moves the whole curve. Default <0,0,0>
axis (vector) – Default <1,0,0>
Curve objects cannot be compounded. A curve can be neither transparent nor textured.
Attributes used less often:
- curve(canvas=mycanvas, emissive=False)
- Parameters:
retain (scalar) – Number of points to retain if points are continually added to the curve.
shininess (scalar) – Default 0.6; Range 0-1.
emissive (boolean) – Default False. Object glows, losing all shading, if True.
visible (boolean) – If False, object is not displayed. Default: True
canvas (object) – Default is
scene.up (vector) – A vector perpendicular to the axis.
Curves cannot use make_trail.
Appending points to a curve
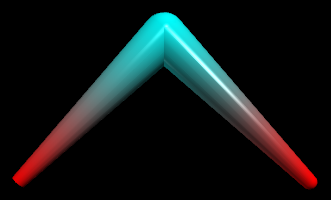
A curve can be created by appending points one at a time. In this case it is possible (but not necessary) to specify a different color and radius for each point in the curve, as is done below:
mycurve = curve()
mycurve.append(pos=vector(-1,0,0), color=color.red,
            radius=0.05)
mycurve.append(pos=vector(0,1,0), color=color.cyan,
            radius=0.15)
mycurve.append(pos=vector(1,0,0), color=color.red,
            radius=0.05)
The code above produces this:
Advanced Methods for Modifying Curves
All attributes of a point can be combined into a Python dictionary. In Web VPython 3.1 and later dictionaries are supported; earlier versions use a JavaScript object literal, whose syntax is essentially the same as curly bracket form of a Python dictionary.
A Python dict describing a point can be constructed like this:
mypoint1=dict(pos=myvector1, color=mycolor1, radius=myradius1)
or like this (same syntax as a JS object literal):
mypoint1 = {'pos':myvector1, 'color':mycolor1, 'radius':myradius1}
For a curve named “mycurve”:
npoints
mycurve.npointsreturns the total number of points in the curve.modify()
mycurve.modify(N, pos=mypos, color=mycolor, radius=myradius, visible=True)alters the Nth point (the starting point is N=0).clear()
mycurve.clear()removes all points from the curve.unshift()
mycurve.unshift( mypointlist )inserts a list of points (dicts) at start of curve.splice()
mycurve.splice( N, howmany, pointlist)inserts a list of points starting at location N.pop()
mydata = mycurve.pop(N)return value of point number N and remove it from curve.point()
mydata = mycurve.point(N)return Nth point (as a dict).slice()
mydata = mycurve.slice(N1, N2)returns list of points (as dicts) from N1-N2.
Color Interpolation in Curves
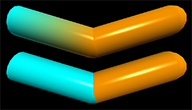
The curve machinery interpolates colors from one point to the next. If you want an abrupt change in color, add another point at the same location. In the following example, adding a cyan point at the same location as the orange point makes the first segment be purely cyan.
c = curve(color=color.cyan, radius=0.2)
c.append( vector(-1,0.5,0) )
# add an extra cyan point:
c.append( vector(0,0,0) )
# repeat the same point:
c.append( pos=vector(0,0,0),
         color=color.orange )
# add another orange point:
c.append( pos=vector(1,0.5,0),
         color=color.orange )
In the image shown here, the upper thick curve, made without the second cyan point, has three pos and color points, cyan, orange, orange, left to right, so the blue fades into the orange. The lower curve includes the extra cyan point and has four pos and color points, cyan, cyan, orange, orange, so there is a sharp break between blue and orange.